Where the money came from.
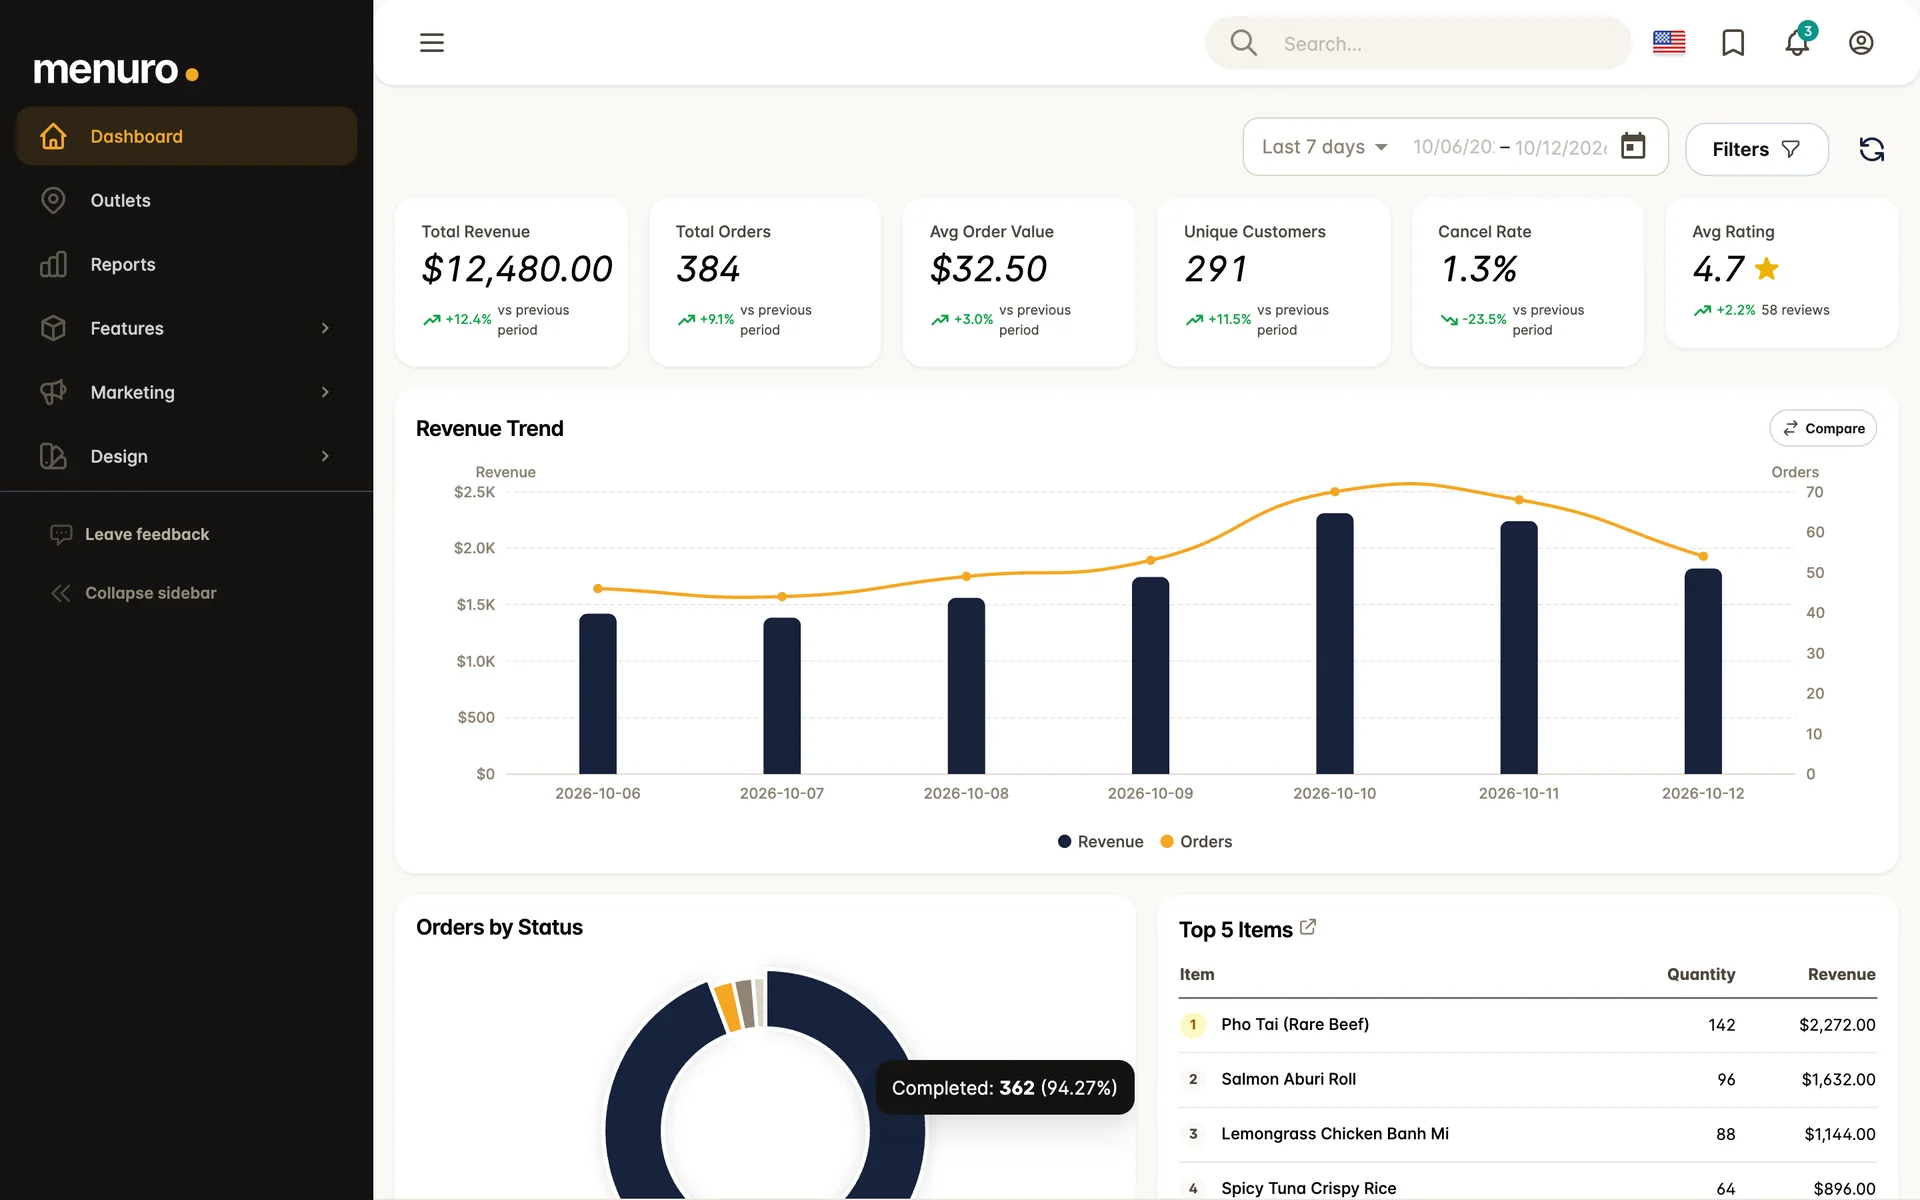
Revenue by outlet, zone, franchise, business type, and payment method. Day-of-week and hourly distribution. Period-over-period trends. Top outlets, top items, ranked.
Revenue by outlet, customer lifetime value, top items, loyalty ROI, campaign performance — the same analytics chains pay six figures for, in your browser. Filter to the day. Drill to the dish. Export to CSV.
Square reports tell you sales. POS reports tell you margins. Neither tells you which customer is about to lapse, which item drives repeat visits, or whether last week's campaign actually paid for itself.
Revenue by outlet, zone, franchise, business type, and payment method. Day-of-week and hourly distribution. Period-over-period trends. Top outlets, top items, ranked.
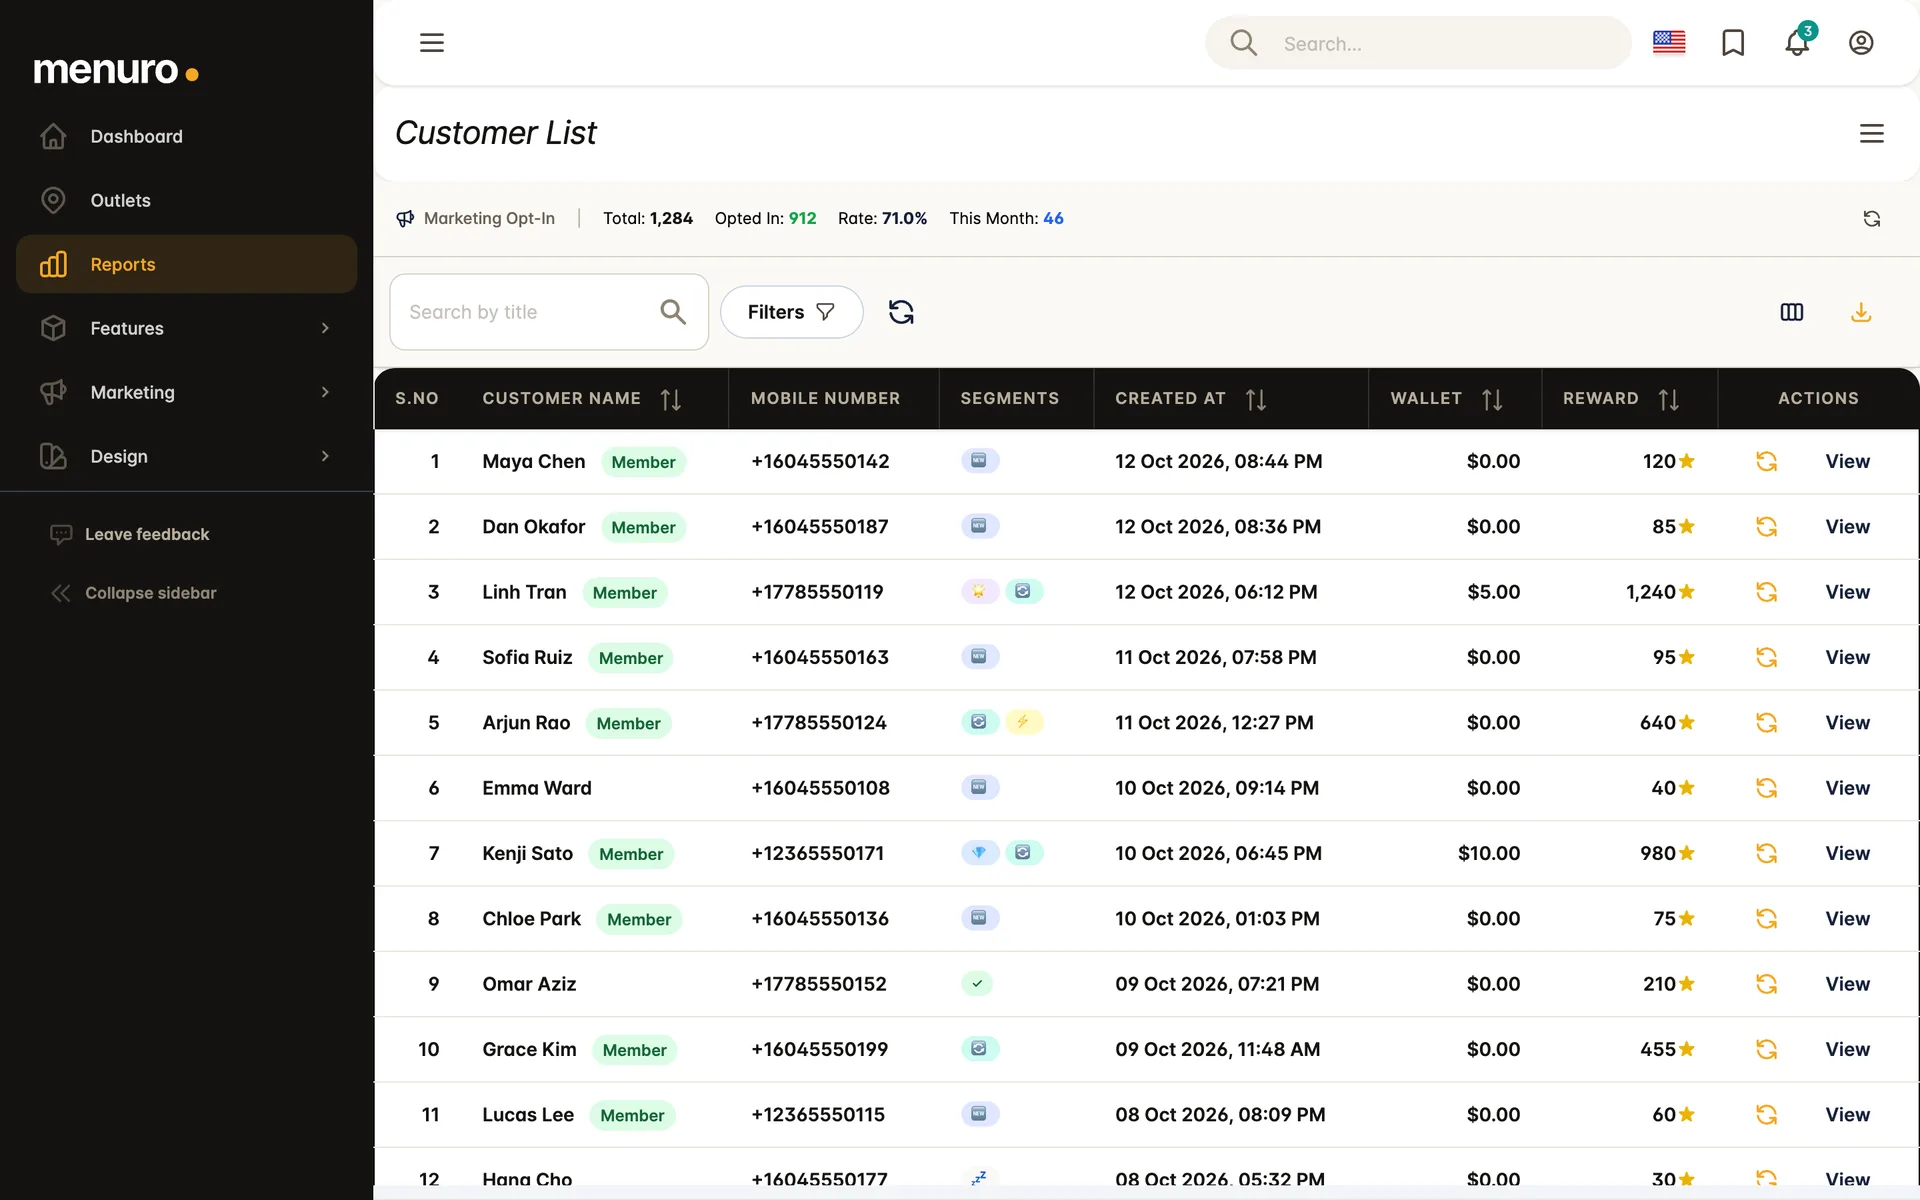
RFM segmentation (Recency · Frequency · Monetary). New vs. returning. Lifetime value. Top spenders. Cancellation frequency. The signal under "we're busy."
Best-sellers by volume and revenue. Per-dish ratings and review aggregation. Category-level performance. Decisions about menu rationalization, pricing, and upsell — grounded.
Driver and outlet earnings with settlement tracking. Pending refunds, aging outstanding. Tax collected by category and method. Commission and payout management with bulk disbursement.
Wallet transaction volume and aggregate balance. Reward earn/redeem rates. Membership renewal, churn, ARPU. Referral conversion and top referrers. Coupon redemption and revenue impact.
Voucher delivery, open, and redemption rates. Campaign ROI calculation. A/B variant comparison. System health and API performance metrics. Marketing spend with a clear answer.
Today, last 7, last 30, this quarter, custom — every report respects the range you pick.
By outlet, zone, franchise, business type, payment method, customer segment. Compose, save, share.
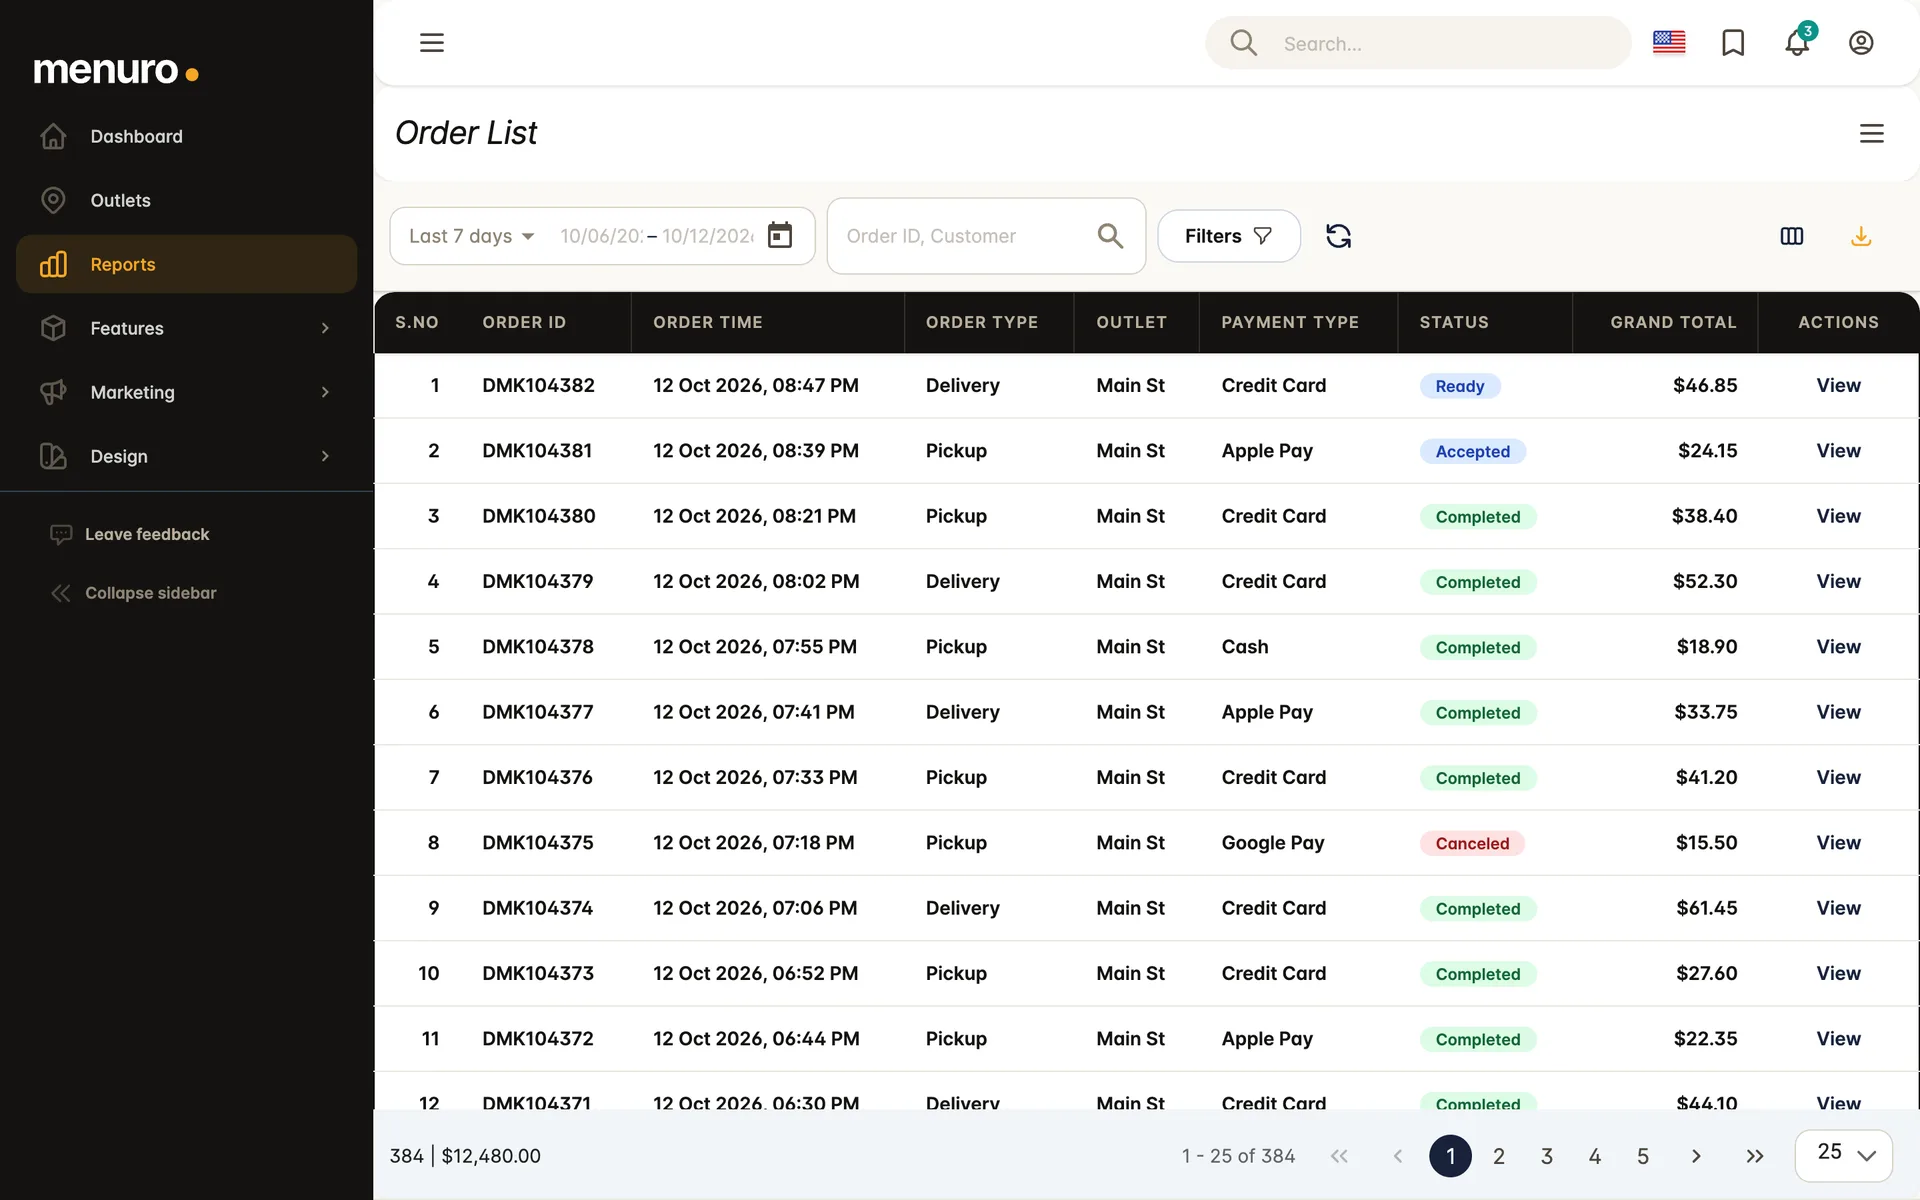
Summary → cohort → individual customer or order. Every chart is a portal, not a dead end.
One click pulls the underlying data. Built for accountants, ops managers, and your own spreadsheets.
Vs. last period, vs. same period last year. Trend lines and deltas everywhere.
Roll up to franchise, drill into outlet, slice by zone. Built for chains as much as single locations.
→ Customer Intelligence · Lapsed cohort. Filter by RFM segment. Export. Send a win-back via Marketing.
→ Item Performance · Combo SKU. Volume, revenue, rating, attach rate vs. baseline.
→ Campaign Performance · Birthday reward · ROI. Sent, opened, redeemed, revenue attributed.
→ Revenue · By outlet · Per-period delta. Drill into the slowest one. Schedule a check-in.
"I used to wait for monthly reports from my POS. Now I see the answer in 30 seconds. The win-back report alone has paid for the platform every month."