Saturday night, 7:30 p.m. Your dining room is full. Every table is ordering the grilled salmon — your second-lowest-margin entrée. Meanwhile, the heritage pork chop that nets you $14 per plate sits at the bottom of column two, sandwiched between the veggie stir-fry and a pasta that hasn't sold well since 2023. Nobody's ignoring the pork chop because they don't want it. They're ignoring it because they never see it.
This is the most expensive invisible problem in the restaurant business. Your menu's most profitable item is almost certainly in the wrong spot, and fixing it costs less than a weekend's worth of food waste.
Your Guests Spend 109 Seconds on Your Menu — and Most of That Time Is Predictable
Gallup research on menu-reading behavior, widely cited in Cornell Hospitality Quarterly studies, found that the average restaurant guest spends 109 seconds looking at a menu before deciding. Less than two minutes. In that window, placement and visual hierarchy do more selling than any description you write.
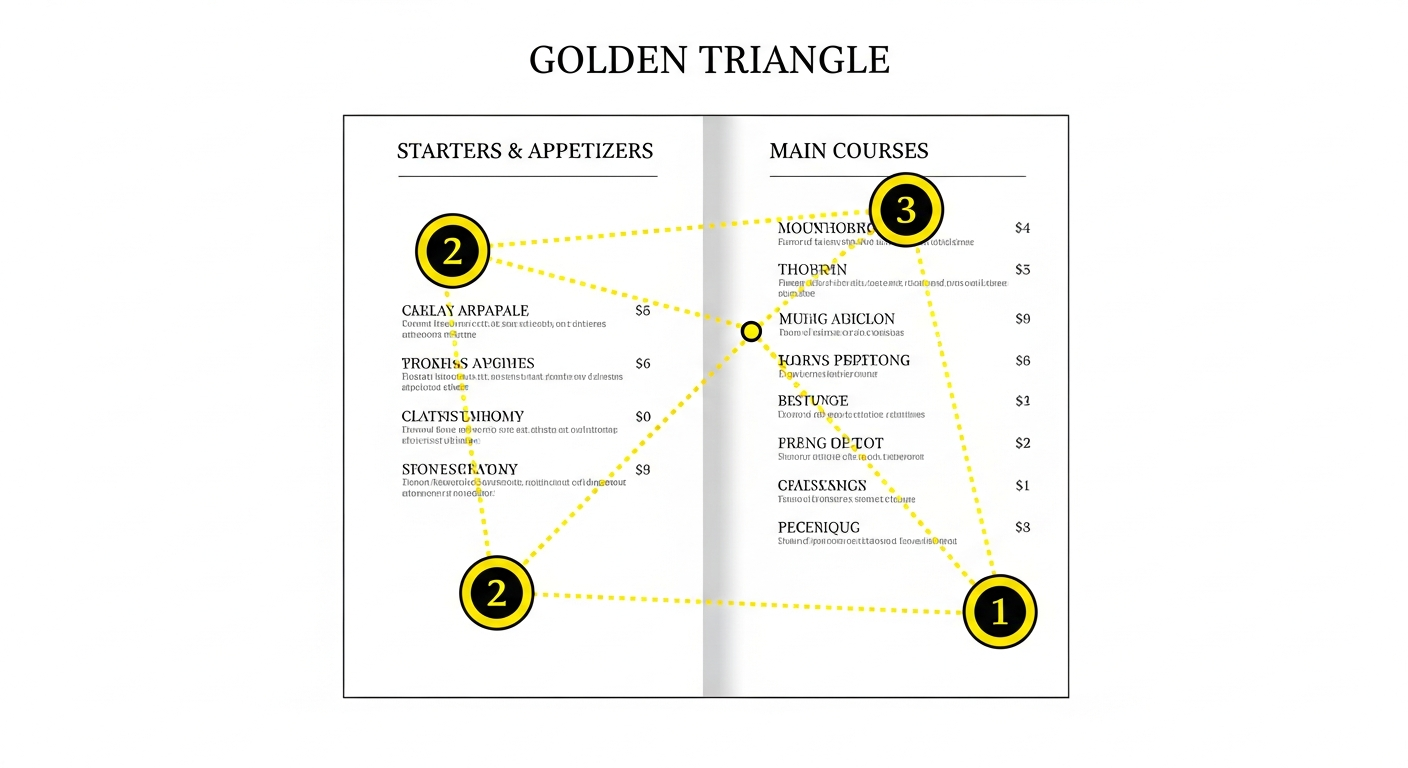
Dr. Sybil Yang, a hospitality researcher at San Francisco State University, conducted eye-tracking studies that mapped exactly where those 109 seconds go. When a guest opens a standard two-panel menu, their eyes follow what Yang calls the "Golden Triangle": first to the center of the right page, then to the top-left, then to the top-right. Items placed in those three zones see order frequency increases of 15–25% compared to items buried at the bottom of a column.
Sweetgreen proved this pattern holds on screens, too. During Q4 2023, the chain moved its Harvest Bowl — one of its highest-margin items — to the #1 position in its app menu. The Harvest Bowl became the most-ordered item for the first time in two years, and same-store sales rose 4% that quarter, according to Sweetgreen's Q4 2023 earnings call.
Olo's 2024 "Beyond the Transaction" report quantified the digital version of the same effect: items in the first three positions of a digital menu category receive 3x more orders than items in positions seven and beyond.
Whether your menu is laminated, printed daily, or displayed on a phone screen, position is the most powerful sales lever you have.
The $800 Fix That Returned $40,000 in a Year
The math on menu repositioning is hard to argue with.
Aaron Allen & Associates, a global restaurant consultancy, published a menu engineering white paper showing that if a restaurant doing $800,000 per year in revenue repositions its highest-margin items and increases average check by 5%, the result is $40,000 in additional annual revenue. A basic repositioning — moving items to the Golden Triangle, adding a visual callout, adjusting price anchoring — costs $200 to $800 using a freelance designer or a one-hour audit from a menu consultant like Gregg Rapp at menuengineers.com.
That's a 50:1 ROI.
Rapp, who has consulted on menu design for over 30 years, shared a case study of an independent casual-dining restaurant in the Midwest that added $200,000 in annual profit from three changes that cost under $1,000 total:
- They moved their highest-margin entrée from position #5 in the list to position #1, leveraging the primacy effect.
- They added a $48 steak at the top of the entrée section as a price anchor, making the $26 target item feel like a reasonable choice by comparison.
- They boxed the target item with a "House Specialty" label.
The restaurant's food cost percentage dropped two full points — from 32% to 30% — because guests shifted from low-margin items to high-margin items. No new ingredients. No new suppliers. No new recipes.
"Most restaurant owners design their menus like a grocery list," Rapp told Restaurant Business Magazine in 2023. "They put items in the order they think of them, not in the order that makes them money."
What Founding Farmers Learned About Brunch
Founding Farmers, the multi-location restaurant group based in Washington, D.C., worked with menu consultants to re-engineer their brunch menu in 2019–2020. The changes were surgical, not dramatic.
They moved their highest-margin brunch items — the chicken and waffles and the farmer's omelette — from the bottom of the brunch section to the top-right panel. They added a "Farmer's Favorite" badge next to each one.
Orders of those items jumped 16% in the first quarter after the change. Average brunch check increased by $3.50 per guest. With roughly 500 brunch covers per weekend location, that $3.50 translates to about $91,000 in additional annual brunch revenue per location, as discussed by their operations team at the 2020 National Restaurant Association Show.
The cost of printing new menus and paying the consultant was a fraction of one month's return.
The Four Moves That Matter Most
Menu engineering has been studied since Michael Kasavana and Donald Smith developed the Stars-Plowhorses-Puzzles-Dogs matrix at Michigan State University. The theory can get academic, but the practical application comes down to four moves that any restaurant can execute this week.
1. Identify Your Stars
Pull your POS sales mix report for the last 90 days. For each item, calculate the contribution margin (selling price minus food cost). Then sort by two dimensions: popularity (number sold) and profitability (contribution margin per plate). Items that are both high-popularity and high-profitability are your Stars. According to the Kasavana-Smith model, Stars should make up 16–20% of your menu items but drive 40–60% of your profit.
If your Stars aren't doing that, they're in the wrong position.
2. Move Stars to the Golden Triangle
Put your highest-margin Star in the center of the right panel (or the first position in each category on a digital menu). Put your second-highest Star at the top of the left panel. If you have a single-page menu, the visual center gets the most attention — that's where Husk in Charleston placed its heritage pork chop after simplifying from 30+ items to 18. Orders of that dish rose 12%, and average check increased $7 per table, as covered in Eater's interviews with chef Sean Brock.
3. Add a Visual Callout
Boxing, shading, or badging a menu item increases its sales by an average of 20%, according to Rapp's research cited in Restaurant Business Magazine. The callout doesn't need to be loud. A thin border and a two-word label — "Chef's Pick," "House Favorite," "Our Signature" — creates enough visual distinction to pull the eye.
Popmenu's 2024 data reinforces this for digital menus: guests who see a photo of a menu item are 30% more likely to order it. An independent pizzeria in Austin used Popmenu's tools to reorder their online menu and add professional photos to their highest-margin specialty pizzas. Within 60 days, online orders for those pizzas increased 28%, and average online order value climbed from $24.50 to $29.10 — an 18.8% increase.
4. Use a Price Anchor
Place your most expensive item at the top of each section. This isn't because you expect everyone to order it. A $48 steak makes a $26 chicken dish feel reasonable. A $22 cocktail makes a $15 cocktail feel like a smart choice. The anchor reframes every price below it.
While you're adjusting prices, consider removing dollar signs. A 2009 Cornell Center for Hospitality Research study by Sybil Yang, Sheryl Kimes, and Mauro Sessarego found that menus listing prices as "29" instead of "$29" increased average check by 8–12%. The dollar sign triggers cost-consciousness. The number alone feels like less of a transaction.
The Cost of Doing Nothing
Aaron Allen & Associates estimated in 2023 that 80% of independent restaurants have never conducted a formal menu engineering analysis. Those restaurants carry food cost percentages 3–5 points higher than optimized competitors. On $1 million in revenue, that gap represents $30,000–$50,000 in lost annual profit.
The average independent restaurant operates on a 3–5% net profit margin, according to the National Restaurant Association's 2024 State of the Restaurant Industry report. A menu that isn't engineered for profitability can be the difference between a 5% margin and a 1% margin.
David Scott Peters, founder of TheRestaurantExpert.com, put it bluntly in a 2024 episode of his podcast: "Your menu is your #1 salesperson, and right now it's probably doing a terrible job. When I audit a restaurant's menu, I almost always find that their most profitable item is buried in the middle of a long list with no visual distinction. The fix takes an afternoon and costs a few hundred dollars. The impact lasts years."
Jim Taylor, managing partner at Benchmark Sixty Restaurant Services, has worked with over 200 independent restaurants on menu optimization. He told RestaurantOwner.com that the average profit increase from a properly engineered menu is 12–18% within the first 90 days. "The biggest mistake we see is what I call 'menu democracy' — treating every item as equally important. Your menu should be a curated sales tool, not a catalog."
Your Digital Menu Needs the Same Treatment
Popmenu's 2024 Restaurant Consumer Trends Report found that 77% of diners look at a restaurant's menu online before visiting. If your online menu is a flat PDF or an alphabetical list, you're losing the sale before the guest walks through your door.
Restaurants using QR code menus saw a 12–22% increase in average check compared to paper menus, according to Olo's 2024 report, largely because digital menus can be dynamically reordered and feature upsell prompts. SevenRooms' 2024 data showed that restaurants sending the menu via email or text before a reservation see 15% higher average checks because guests pre-decide on higher-ticket items without time pressure.
Square's 2024 Future of Restaurants Report noted that restaurants using data-driven menu optimization — including item placement changes based on sales mix analysis — reported average revenue increases of 10–15% without adding new menu items.
The same Golden Triangle principles apply to your app, your website, and your QR code menu. First position gets 3x the orders. Photos increase order likelihood by 30%. A "Featured" badge works on a screen the same way a box works on paper.
The Afternoon Checklist
You can start this today. No consultant required for the first pass.
This afternoon: Pull your POS sales mix for the last 90 days. Identify your top five items by contribution margin. Check where each one sits on your current menu — physical and digital.
This week: Move your top-margin item to the first or second position in its category. Add a simple visual callout. If you have a two-panel menu, place it in the center-right zone.
This month: Add a price anchor to each section. Test removing dollar signs. If you have an online menu, reorder it to match your physical menu's new hierarchy and add photos to your top three margin items.
In 90 days: Pull the sales mix again. Compare. Jim Taylor's data across 200 restaurants suggests you should see a 12–18% profit increase. Even half that number, on a restaurant doing $800,000 a year, is $48,000 or more in annual profit from an afternoon's work.
TGI Friday's proved this works at chain scale — their 2018–2019 menu redesign increased average check by 2.5% and cut food waste by 15%, as covered in QSR Magazine. But the math is even more favorable for independents, because you can move faster and the relative impact on a tighter margin is larger.
Your most profitable item has been sitting in the wrong spot. The fix costs less than your weekend linen service. The return starts with the next guest who opens your menu.
See How Menuro Puts Your Best Items Front and Center
Menuro gives you a digital menu and ordering platform where you control item placement, featured badges, and photos — and you can update all of it in minutes, not weeks. If you want to put these menu engineering principles to work across your app, online ordering, and in-house QR menus without waiting on a designer, book a free demo at menuro.io/demo and we'll walk you through it.