Your cedar-plank salmon has a $9.20 contribution margin. Your kitchen nails it every time. Guests who order it love it. But it sits seventh in a list of twelve entrées, sandwiched between the chicken parmesan and a pasta that costs you almost as much to plate as you charge for it.
Seven and a half people a day order the salmon. Meanwhile, the chicken parm — a $4.10 margin dish — outsells it three to one because it's the second item guests see when they open the entrée section.
That ordering gap, repeated across 30 days, works out to roughly $4,200 in profit you prepared for, prepped for, and never collected.
This isn't a hypothetical. Menu engineer Gregg Rapp, one of the most cited menu consultants in the U.S., has documented that moving a high-margin item from a dead zone to a prime visual position increases that item's orders by 15–25%. On a dish with a $7–$10 contribution margin at a restaurant doing 150–200 covers a day, that repositioning recovers $3,800–$6,200 per month in profit that was otherwise invisible on the P&L.
The fix costs nothing. No new equipment, no new hires, no recipe changes. You rearrange words on a page.
Your Guests Spend 109 Seconds on Your Menu — and Read a Third of It
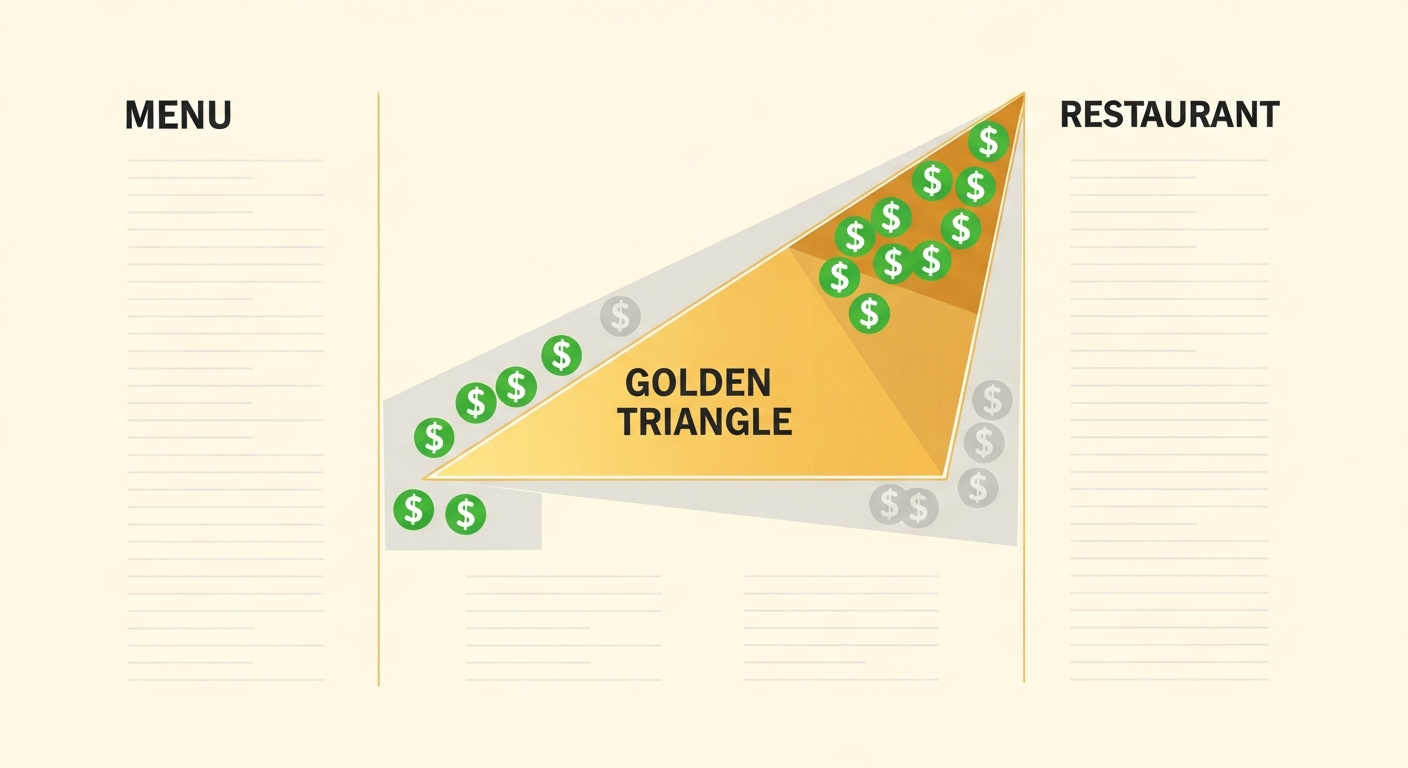
Aaron Allen & Associates, a global restaurant consultancy, has tracked how diners interact with menus using eye-tracking studies. The findings are consistent: guests spend an average of 109 seconds reading a menu. Their eyes land first on the center of the page, then move to the top-right corner, then the top-left. This pattern forms what the industry calls the "Golden Triangle."
Items inside the triangle get the most visual attention. Items outside it — the bottom-left of a multi-page menu, the middle of a long single-column list, the second page — get skipped by a significant percentage of diners.
Gallup research (widely cited in hospitality literature) puts a finer point on this: the average diner reads about one-third of menu items before deciding. That means roughly 67% of your menu items may never be consciously evaluated by a given customer.
So when your highest-margin dish lives at position seven out of twelve, most guests never get there. They've already decided on something else — often a familiar, lower-margin comfort item like a burger or chicken tenders. Bournemouth University research on menu size and food sales found that menus exceeding 7 items per category in casual dining push diners toward these "safe" low-margin choices through choice overload.
The result: your plow horses (high popularity, low profitability) dominate orders while your puzzles (high profitability, low popularity) collect dust. According to benchmarks from Menu Engineers LLC and Aaron Allen & Associates, about 28% of the average restaurant's menu consists of high-profit items that are chronically underordered. These are the buried items.
The Placement Math: From 5% to 12% Order Rate
Let's build the $4,200 calculation with conservative numbers.
Say your buried high-margin item has an $8.00 contribution margin. You serve 150 covers a day. At its current position, 5% of guests order it — that's 7.5 orders per day.
After you move it into the Golden Triangle, add a visual callout (a box, a "Chef's Pick" label, or a brief story about the dish), its order rate climbs to 12%. That's 18 orders per day.
The difference: 10.5 additional orders × $8.00 margin = $84 per day. Over 30 days, that's $2,520 in recovered profit. At higher-volume locations doing 200+ covers, the number crosses $4,200 per month. Annualized, you're looking at $30,000–$50,000 that was sitting on your menu the entire time.
This math is consistent with case studies published by Menu Engineers LLC, Aaron Allen & Associates, and Toast's menu optimization guides.
Aaron Allen has stated in his published research and Forbes contributor columns (2024): "Menu engineering is the single highest-ROI activity a restaurant can undertake. It costs almost nothing to rearrange your menu, yet the profit impact can be immediate and dramatic. We routinely see 8–12% profit lifts within 30 days of a menu redesign."
When your profit margin sits between 3% and 9% (Toast's 2024 Restaurant Trends Report puts full-service restaurants at 3–5%), an 8–12% profit lift from a zero-cost change is not a rounding error. It's the difference between a month in the black and a month in the red.
Real Restaurants That Moved the Needle by Moving Menu Items
Snooze, an A.M. Eatery (Denver, CO — 50+ locations) ran a menu engineering overhaul in 2023 using POS data cross-referenced with item placement. Their analytics team discovered that their highest-margin pancake flights ($16.50, approximately 72% contribution margin) were buried on page 2, while lower-margin egg dishes dominated page 1. They moved the pancake flights to the top-right of page 1 and added a visual callout box. Pancake flight orders increased 28% across test locations, and average check rose $1.85 per guest. Annualized across their system, Nation's Restaurant News reported that this represented an estimated $1.2 million in incremental profit.
Founding Farmers (Washington, D.C. — multiple locations) worked with menu consultants in 2022–2023 and took a two-pronged approach. They cut total menu items by 18% and repositioned their highest-margin entrées (including their signature chicken and waffles and cedar-plank salmon) into prime visual real estate with boxed callout sections. Restaurant Business Magazine reported a 12% increase in per-person check average and a measurable shift in product mix toward higher-margin items within the first quarter.
Hattie B's Hot Chicken (Nashville, TN) optimized something most operators overlook: side-item placement. In 2023, they moved higher-margin sides and extras (mac & cheese, pimento cheese, banana pudding) into more prominent positions on both physical menu boards and their online ordering platform. QSR Magazine reported a 17% increase in side-item attachment rate, translating to $1.50–$2.00 more per ticket.
Even at the smallest scale, placement matters. Pane Bianco, Chris Bianco's acclaimed sandwich shop in Phoenix with only 6–8 items on the menu, moved their highest-margin seasonal sandwich from the bottom of the board to the #2 position (right below their most popular item). Staff reported in local food media interviews in 2024 that the sandwich's daily sales jumped roughly 35%.
Your Most Profitable Item Is Buried on Your Digital Menu Too
Physical menu placement gets most of the attention, but for many restaurants, the bigger leak is digital. Popmenu's 2024 Restaurant Consumer Trends Report found that 78% of consumers look at a restaurant's menu online before visiting or ordering. If your digital menu buries profitable items, the placement problem starts before anyone walks through your door.
Olo's 2024 data, drawn from millions of digital orders, shows a stark position bias: the first item in an online ordering category receives 2–3x the orders of an item placed sixth or lower in the same category. The Olo data science team noted that "restaurants that intentionally sequence by margin rather than alphabetically or by price see measurably better unit economics."
Yet Square's 2024 Future of Commerce report found that fewer than 30% of restaurants have optimized their digital menu sequencing for profitability. The majority still list items alphabetically or in whatever order their POS system imported them.
Three specific digital fixes have documented impact:
1. Resequence by margin, not alphabet. Put your highest-margin items in the first two positions of each category. Olo's data confirms these positions capture a disproportionate share of orders.
2. Add a "Featured" or "Recommended" tag. Paytronix's 2024 Order & Delivery Report found that a simple featured tag on a digital menu item increases its selection rate by 20–30%.
3. Add photos to your highest-margin items. Popmenu's 2024 analysis of 10,000+ restaurant menus found that items with photos see 25–30% higher order rates. You don't need to photograph everything — focus on the three to five dishes where margin recovery matters most.
Sterling Douglass, co-founder and CEO of Chowly, told Restaurant Dive in 2024: "Most restaurants build their online menu once and never touch it again. But the data shows that item sequencing, photography, and featured placement in digital ordering can move the needle on average check by $2–$4."
A $2.00 increase in average check, applied across a loyal customer visiting 2.6 times per month (Paytronix's 2024 average for casual dining), compounds to $250–$500 in additional lifetime value per customer over a five-year relationship, based on SevenRooms' 2024 customer lifetime value data.
A 30-Minute Menu Audit You Can Do Tonight
You don't need a consultant for the first pass. Here's a practical sequence:
Pull your product mix report from your POS. Sort every item by contribution margin (menu price minus food cost). Identify your top five highest-margin items.
Cross-reference with sales volume. Which of those high-margin items are in your bottom 50% for order frequency? Those are your puzzles — profitable dishes that guests aren't ordering enough.
Check where those puzzles live on your menu. Are they below the fold on a two-page menu? Sixth or seventh in a long category list? On the second screen of your online ordering platform? If so, you've found your buried profit.
Move them. On your physical menu, place them in the Golden Triangle (center, top-right, or top-left of the page or section). Give them a visual anchor: a box, a brief description with sensory language, a "Chef's Pick" label. On your digital menu, move them to position one or two in their category and add a photo.
Measure for 30 days. Compare the product mix report before and after. Matt Rolfe, CEO of Westshore Hospitality and a restaurant consultant who audits menus weekly, described the typical result to Foodservice and Hospitality Magazine in 2024: "Move it to the top right, put a box around it, give it a story — and watch it go from 6% of orders to 18% overnight."
The NRA's 2024 State of the Restaurant Industry Report lists inability to manage food costs and optimize product mix as one of the top three operational reasons restaurants close. You can't control rent increases or labor costs overnight, but you can control where your $9 margin dish sits on the page. That's a lever most restaurants have never pulled.
Sweetgreen offers a useful model for ongoing optimization. In their 2024 Q1 earnings call, CEO Jonathan Neman discussed how the company uses menu personalization and sequencing in their app to surface higher-margin seasonal bowls. Digitally-optimized menu placement contributed to a 5% same-store sales increase in Q1 2024 with a notable shift toward items with better unit economics. You don't need Sweetgreen's data science team to apply the same principle: put the dish you want to sell more of in the spot where the most eyeballs land.
Black Box Intelligence's Q4 2024 data draws a sharp line between restaurants that manage this actively and those that don't. Restaurants in the bottom quartile of average check growth experienced negative same-store sales growth of -2.3%. Top-quartile restaurants — those managing menu engineering and check optimization — saw +4.7% same-store sales growth. A 7-point spread, driven in part by where items sit on a page.
Gregg Rapp put it plainly in interviews with Restaurant Hospitality and FSR Magazine: "The menu is the only piece of advertising that 100% of your customers read. Yet most restaurants treat it as an afterthought — a list of dishes rather than a selling tool. I've seen restaurants leave $50,000 to $100,000 a year on the table because their highest-margin item is in the wrong spot on the page."
Your menu is already printed, already posted online, already in front of every guest. The question is whether it's selling what you need it to sell.
See How Menuro Puts Your Most Profitable Items Front and Center
Menuro gives you full control over item sequencing, featured tags, and photo placement on your own branded ordering app — so your highest-margin dishes show up where guests look first, every time. No algorithms deciding for you, no third-party platform burying your best items behind sponsored competitors.
Book a demo at menuro.io/demo and we'll walk through your current menu setup in 15 minutes.