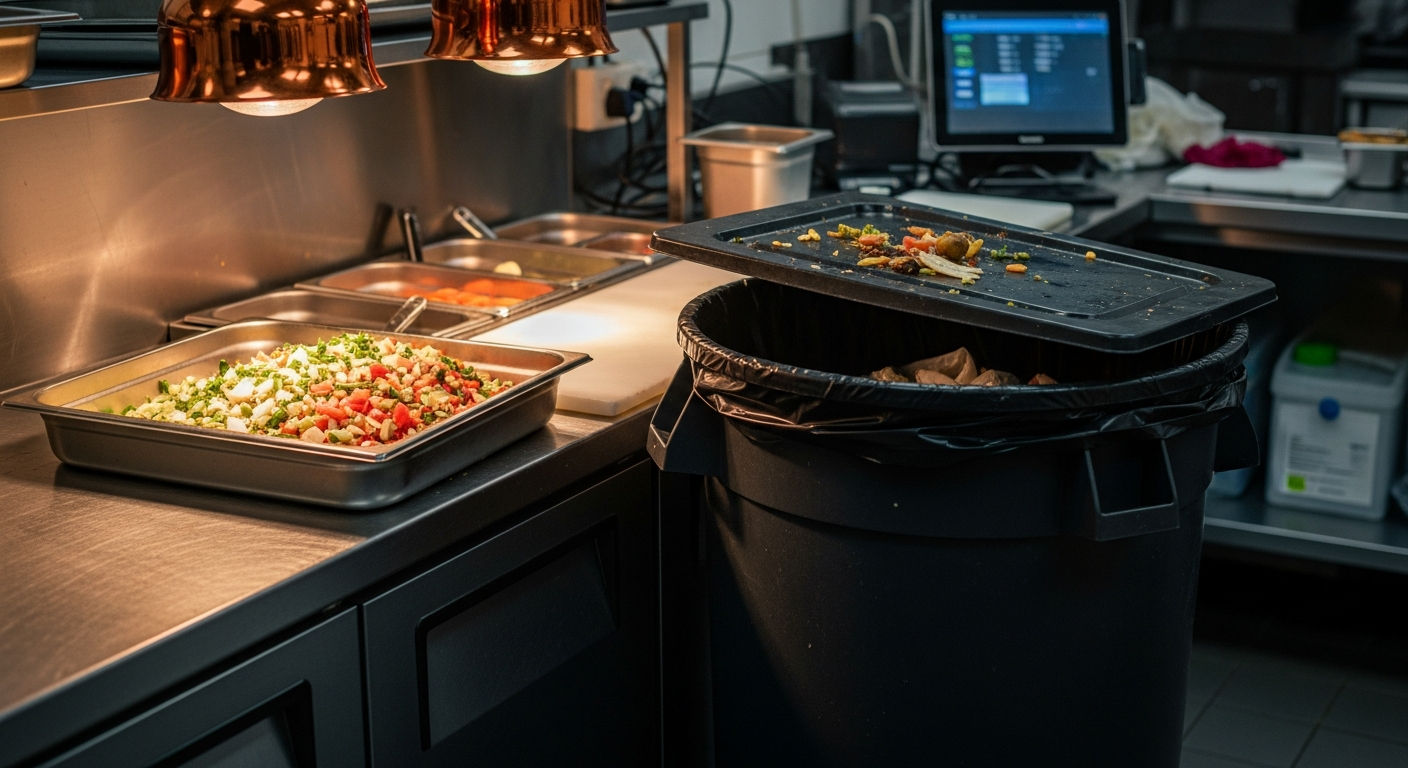
It's 10:45 p.m. on a Tuesday. Your closing cook scrapes two hotel pans of prepped chicken into the trash, dumps a third pan of wilting mixed greens, and tosses a quart of house vinaigrette that expired this morning. Nobody writes it down. Nobody logs it in the POS. The garbage bag goes into the dumpster, and somewhere between $40 and $90 vanishes from your margin in a single close-out.
Do that five or six nights a week, add in over-portioned proteins, bread that got baked but never sold, and produce that spoiled before anyone touched it, and you're looking at $1,500 to $2,500 per month in avoidable waste. That figure comes from LeanPath's 2024 food waste prevention platform data, corroborated by Toast's 2025 Restaurant Trends Report, and it lines up with what consultant David Scott Peters has found across more than 700 independent restaurants he's worked with. "The POS data is screaming at them, but nobody's listening," Peters said in a 2024 episode of his podcast.
The painful part: the information needed to prevent most of that waste is already sitting inside your point-of-sale system. You're paying for it. You're collecting it every shift. And according to Popmenu's 2024 Restaurant Trends Report, 66% of independent operators never use that data to adjust purchasing or menu decisions.
The Gap Between What You Bought and What You Sold
Every restaurant has two food costs. There's the theoretical food cost — what your food cost should be based on recipes, portions, and what the POS says you sold. Then there's the actual food cost — what you spent on food minus what's left in inventory.
The difference between those two numbers is your variance, and it represents waste, theft, over-portioning, and spoilage combined.
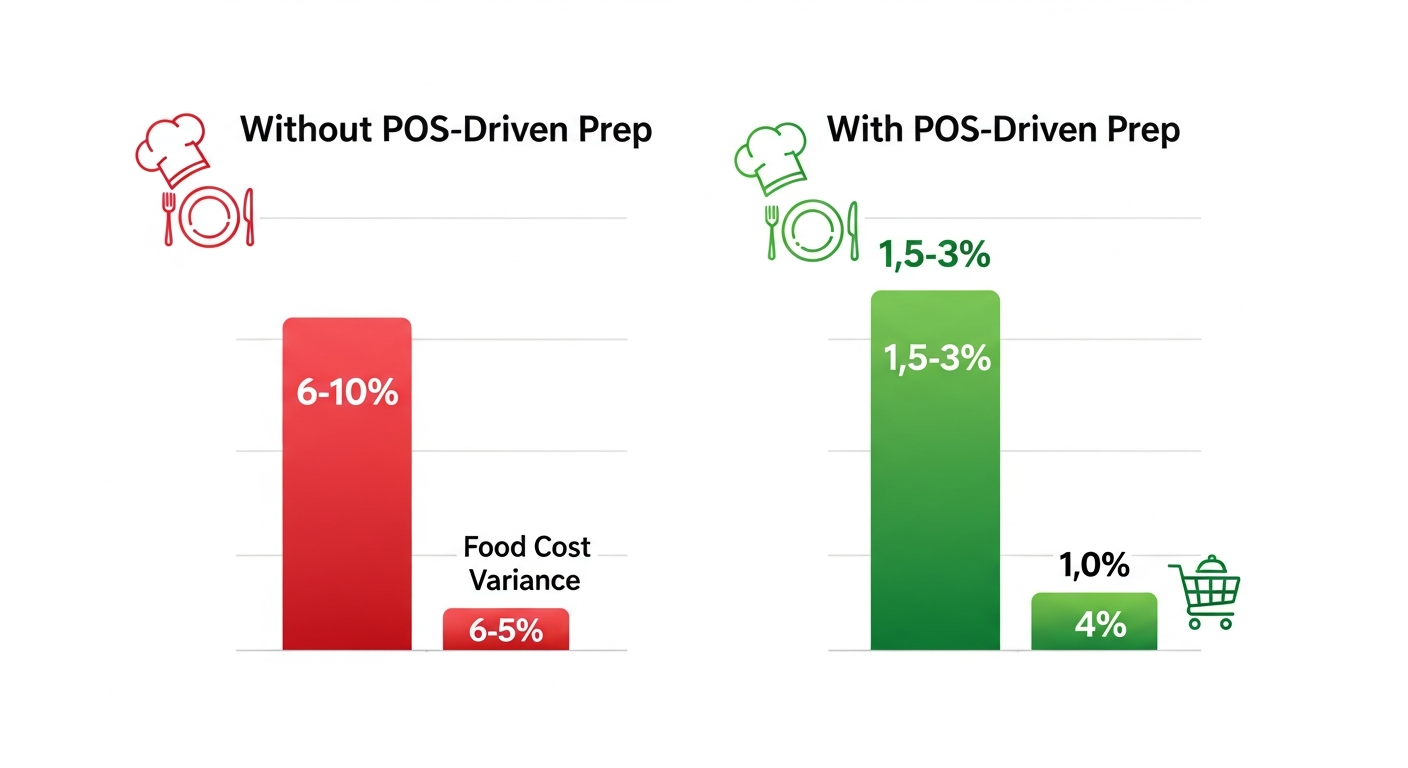
Restaurant365's 2024 benchmark data puts the average variance at 5–8% for restaurants that don't actively reconcile these numbers. Restaurants that check weekly using POS data keep variance between 1.5% and 3%. On a restaurant doing $1 million in annual revenue, that gap is worth $21,000 per year.
The best-in-class operators keep variance under 2%. Poorly managed kitchens run above 10%. If your food cost is sitting at 35% and your theoretical cost should be 31%, that four-point spread on $100,000 in monthly revenue is $4,000 a month going somewhere other than your bank account.
xtraCHEF (Toast's invoice automation tool) reported in 2024 that restaurants using POS-linked food cost tracking found an average of $1,400 to $2,100 per month in cost variances — money that was invisible until someone connected purchasing invoices to sales data.
Your POS Knows What Sold on Every Tuesday for the Last Year
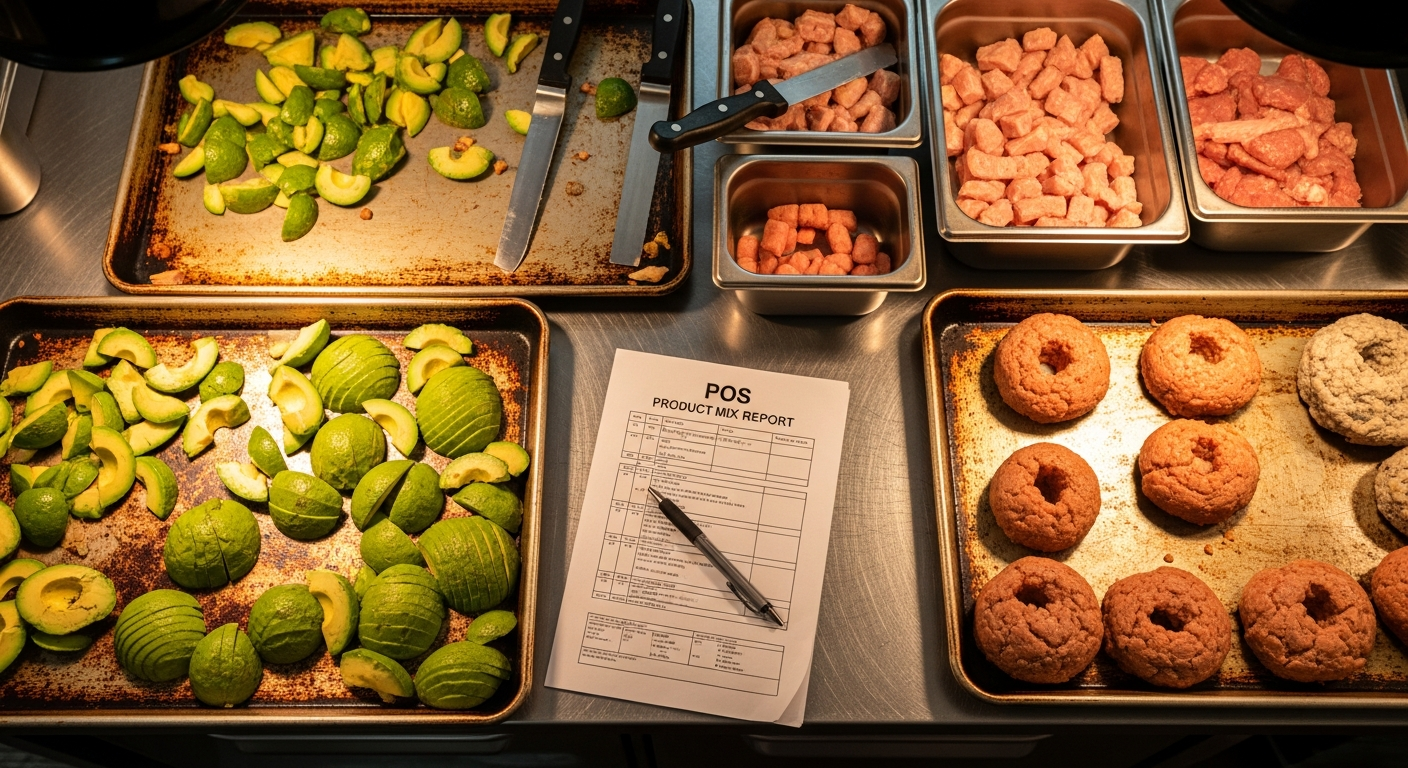
The product mix report (sometimes called a PMIX) is the single most useful and most ignored report in your POS. It tells you exactly how many of each menu item sold, broken down by day, daypart, and server. Cross-reference that with your prep sheets, and the waste becomes visible.
Founding Farmers in Washington, D.C. learned this the hard way. The five-location full-service restaurant partnered with LeanPath to install waste tracking in their kitchens. When they compared waste data against POS sales, they discovered that Sunday brunch prep was costing $2,200 per month per location in waste. The reason: Sunday covers had dropped 18% from 2019 levels due to post-COVID traffic shifts, but the prep sheets still reflected pre-pandemic volumes. Nobody had updated them. After adjusting prep to match what the POS showed they were selling, Founding Farmers cut brunch waste by 41%.
Homegrown Sustainable Sandwiches, a 10-location chain in Seattle, ran a similar exercise using BlueCart's POS-linked ordering system. They found $1,600 to $1,900 per month per location disappearing into bread waste (over-baking), protein spoilage (over-ordering), and sauce waste (batch sizes too large for actual demand). After building ordering around POS sales velocity, they cut total food waste by 33% and improved margins by 1.8 percentage points.
These aren't stories about massive technology investments. They're stories about reading reports the POS was already generating.
The Overproduction Problem Is Bigger Than You Think
The Boston Consulting Group estimated in its 2024 food waste report that 10% of all food purchased by restaurants is wasted due to overproduction — making too much of items that don't sell. BlueCart's 2024 data backs this up: the average restaurant carries 15–20% more inventory than needed because purchasing runs on gut instinct instead of sales data.
Melt Shop, an eight-location fast-casual chain in New York, discovered through MarketMan's POS-integrated inventory system that cheese waste alone was costing $800 to $1,200 per month per location. The culprit was over-portioning during prep and producing more than the POS data justified. After implementing POS-driven par levels and portion alerts, Melt Shop reduced food waste by 28% and improved food cost by 2.3 percentage points within six months.
Rubio's Coastal Grill found an even more specific problem across its 150+ California locations. Avocado waste was running $45,000 per month chain-wide — about $300 per location — because prep volumes didn't match what the POS said customers were ordering. Building automated par sheets from trailing four-week POS sales data cut produce waste by 22%.
Chef Dan Barber of Blue Hill at Stone Barns put it bluntly in a 2024 James Beard Foundation keynote: "Waste is a design flaw. If your menu doesn't respond to what's selling — and your POS tells you exactly what's selling — then you've designed a system that produces waste by default."
The Dollar Math on a $1M Restaurant
Let's make this concrete for an independent doing $1 million in annual revenue with a 34% food cost.
That's $340,000 a year in food purchases, or about $28,300 per month.
The World Resources Institute's Champions 12.3 initiative found in its 2024 update that restaurants lose 4–10% of food purchased before it reaches a customer. At the low end, that's $1,132 per month. At the midpoint, it's $1,840. At the high end, $2,830.
Now consider what happens when you cut that waste by even a third — a conservative target given that Winnow Solutions' 2024 data showed 40–70% reductions with active tracking. A one-third reduction on $1,840/month in waste saves $607/month, or $7,284 per year.
For a restaurant running a 4% net margin ($40,000 annual profit), that $7,284 represents an 18% increase in net profit. No new customers required. No menu price increases. No marketing spend.
Square's 2024 Future of Commerce Report found that restaurants using data-driven inventory management saw a 3–5% improvement in food cost percentage. On $1 million in revenue, that's $30,000 to $50,000 in annual savings.
Restaurant365's benchmark data showed that operators who reconcile actual vs. theoretical food costs weekly maintain food costs 2.1 percentage points lower than those who reconcile monthly or skip it altogether. On $1M in revenue, 2.1 points is $21,000.
However you slice the numbers, the savings from using data you already own dwarf the effort required to read it.
Why Most Kitchens Still Prep by Feel
If the data is right there, why do 66% of independents ignore it?
Jim Taylor, CEO of restaurant consulting firm Benchmark Sixty, offered an answer in a 2024 interview with Restaurant Business Online: "The POS system is the most underutilized asset in most restaurants. It knows exactly what sold, when it sold, and in what quantity — but 70% of operators never use that data to adjust their prep sheets or purchasing. They're paying for intelligence they never read."
Part of the problem is that most POS systems bury the useful reports three or four clicks deep. Part of it is that kitchen managers learned to prep from experience, not spreadsheets, and changing that habit requires someone to champion the switch. And part of it is that waste feels small in the moment — a handful of prepped onions here, two extra portions of salmon there — until you total it up over a month.
Andrew Shearer, CEO of Winnow Solutions, described the perception gap in a 2024 QSR Magazine interview: "We've seen kitchens where the head chef was convinced waste was 2–3% of food cost. When we installed tracking and cross-referenced with POS data, the real number was 8–12%. The gap between perception and reality is where the money disappears."
Popmenu's 2024 survey found that 47% of independent restaurant owners who described themselves as "struggling financially" also reported using no inventory management software. Among owners who said their business was healthy, only 18% lacked such tools. That's correlation, not causation, but the pattern is hard to dismiss.
A Five-Step Process That Costs Nothing But Time
You don't need AI-powered cameras or a $500/month software subscription to start. Here's what to do this week with the POS you already have:
1. Pull your product mix report for the last 30 days. Sort by day of week. Identify the five lowest-selling items on each day. These are your overproduction risks.
2. Compare those numbers to your current prep sheets. If you're prepping 20 portions of a dish that sells 8 on Wednesdays, you've found waste. Adjust par levels to match trailing sales data plus a 10–15% buffer.
3. Run a theoretical food cost on your top 10 sellers. Multiply each item's recipe cost by the number sold. Compare that total to what you spent on those ingredients (pull invoices). The gap between those numbers is your variance.
4. Track waste for one week. Put a sheet and a scale next to the trash can. Have cooks write down what they throw away and weigh it. You'll be surprised. Mei Mei in Boston did this manually and found $1,500/month in vegetable trim waste and overproduced specials. Owner Irene Li used that data to redesign the menu around what was selling and cut waste by 40%.
5. Repeat weekly. Restaurant365's data shows that weekly reconciliation keeps food costs 2.1 points lower than monthly checks. Build it into your Monday morning routine alongside your ordering.
Black Box Intelligence's Q4 2024 data showed that top-quartile restaurants by profitability maintain food costs 3.2 percentage points lower than bottom-quartile restaurants. The primary differentiator was data-driven purchasing and waste management. Not fancier food. Not higher prices. Better use of information they already had.
The Compounding Cost of Not Looking
With same-store traffic declining 1.2% year-over-year according to Black Box Intelligence's December 2024 data, and food costs rising to 33–35% of revenue per the National Restaurant Association's 2025 report, every dollar of waste matters more than it did two years ago.
A restaurant losing $1,800/month to preventable waste is burning $21,600 a year. Over three years, that's $64,800 — enough to fund a kitchen renovation, hire a sous chef, or build a six-month cash reserve.
The ROI on food waste prevention technology runs 5:1 to 8:1 within the first year, according to the World Resources Institute's Champions 12.3 initiative. But the first step doesn't require any technology beyond what's already plugged into your counter. It requires someone to pull the report, read the numbers, and adjust the prep sheet.
Your POS knows what your kitchen is throwing away. The question is whether anyone on your team is willing to look.
See What Your Data Can Do
Menuro helps independent restaurants connect their ordering data to smarter operations — from understanding what sells and when, to building direct ordering that keeps your customer relationships (and your margins) in your hands. If you want to see how it works, book a free demo at menuro.io/demo.